Social security
Lisa Putman, Simone Croezen and Cok Vrooman
Social security

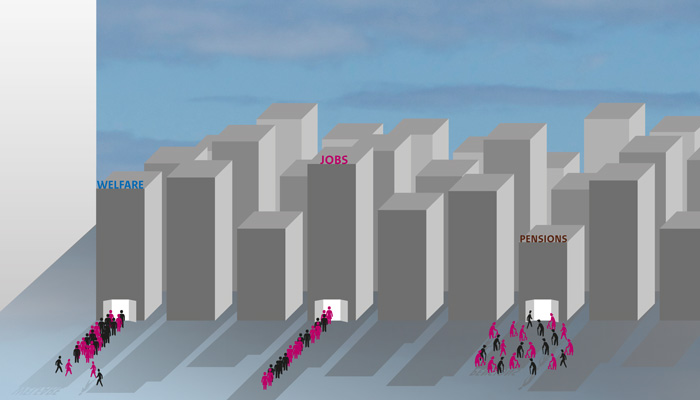
With the implementation of social security policies, countries aim to combat poverty and provide income protection and job security at different stages in life. Within the EU, social security is essentially a national responsibility of each Member State. Due to diversity in the traditions of social security provision, there are considerable differences among countries (Castles 1993; Castles et al. 2010; Svallfors 2010; Vrooman 2012). Given this huge institutional variety, it is important to assess how countries perform with regard to social security.

Our analysis is not limited to the 28 EU Member States, but considers Norway and Switzerland as well. Four indicators lie at the heart of the overall achievement score on social security: contextual poverty, pension replacement rates, non-employment in youth and long-term unemployment. Of the countries under study, The Netherlands, Austria, Luxembourg and Denmark offer their citizens the best protection against social risks. The citizens of Greece, Spain and Romania are found to be less protected.

Countries with good social security performance: The Netherlands, Austria, Luxembourg and Denmark

Although the Netherlands, Austria, Luxembourg and Denmark are overall the best performers on social security, it does not mean that they are in the top four on each indicator. As for poverty issues, Luxembourg performs well, with just 5% of the population living below the poverty line in 2011 (Figure 1). This is the best score for all EU-28 nations, Norway and Switzerland. Norway comes second with 7% of the population experiencing hardship, followed by Switzerland with 9%. In the other countries with the best overall performance on social security, The Netherlands, Austria and Denmark, (less than) one fifth of the population lives in poverty.

Both the Netherlands and Austria are among the top performers on pension replacement rates for all income groups (Figure 2). With regard to low-income groups, Denmark achieves the best results and Luxembourg falls in the range of average performers. Other countries that score relatively well on pension replacement rates are Bulgaria and Hungary.

The four top performers also show very low levels of non-employment in youth, with rates between 5% and 7% (Figure 3). Their scores on long-term unemployment are also relatively positive, ranging from 1.5% to 2.5% (Figure 4). Germany also has a low rate of non-employment in youth. Long-term unemployment is lowest in Norway. Finland and Sweden also score relatively well on this issue, with respectively 1.5% and 1.7% of the working population affected.

Figure 1
Contextual poverty[1] (absolute threshold based on the Dutch modest but adequate reference budget) (in %)
Country 2005 2011
Country 2005 2011
Austria 12 12
Belgium 18 13
France 19 18
Germany 17 15
Ireland 22 25
Luxembourg 4 5
Netherlands 11 12
United Kingdom 17 23
Denmark 16 20
Finland 22 20
Norway 8 7
Sweden 20 19
Greece 43 57
Cyprus 19 14
Italy 30 27
Portugal 61 59
Spain 35 44
Bulgaria 97 84
Czech Republic 62 52
Estonia 80 69
Hungary 82 74
Latvia 87 80
Lithuania 87 77
Poland 84 64
Romania 96 97
Slovak Republic 94 55
Slovenia 31 36

Notes: The diagonal line separates the countries that improved their score (located below the line) from the ones that saw their score deteriorate (located above the line).
Source: EU-SILC, SCP treatment

Figure 2
Net pension replacement rates by individual earnings[2] for men (women where different), as % of pre-retirement earnings, 2012
Country Low earners Average earners High earners
Austria 91 90 86
Belgium 81 62 48
France 76 71 61
Germany 55 57 56
Ireland 76 45 35
Luxembourg 87 69 67
Netherlands 105 101 97
Switzerland 78 75 49
United Kingdom 67 42 31
Denmark 117 77 67
Finland 71 63 63
Norway 91 63 51
Sweden 69 55 73
Cyprus 71 75 74
Greece 93 70 65
Italy 84 81 83
Malta 66 70 50
Portugal 78 68 68
Spain 79 80 80
Bulgaria 108 108 85
Czech Republic 98 64 51
Estonia 80 62 55
Hungary 94 95 96
Latvia 73 68 65
Lithuania 101 73 62
Poland 61 60 59
Romania 52 54 53
Slovak Republic 88 85 85
Slovenia 64 63 61

Source: OECD Statistics (ELS Pensions, 2015)

The bottom three in social security performance: Greece, Spain and Romania

What holds for the best overall performers, also holds for the countries at the other end of the ranking: they do not score the lowest on every indicator. Around half of the populations of Greece and Spain is considered poor, but Bulgaria, Latvia, Lithuania, Croatia and Hungary are part of a group with even higher shares of the population living under the poverty line (Figure 1). Romania has the highest level of poverty. The increase in poverty, however, is greatest in Greece.

Around one fifth of youth in Greece, Spain and Romania is non-employed (Figure 3). Several other countries, including Italy, Bulgaria, Croatia and Cyprus, have comparable figures. But Spain and Greece are in a group, along with Italy and Portugal, with large increases in youth unemployment.

Long term unemployment is highest in Greece and Spain, and Romania is among the countries with average performance (Figure 4). On pension replacement rates, though, Romania scores relatively poorly (Figure 2). It coincides with Germany on pension replacement for low-income groups, and with Ireland and the United Kingdom for the average and high-income groups. Scores on pension replacement rates are generally high for Greece and Spain.

Figure 3
Non-employment in youth (% of young people aged 15-24 years who are not in employment and not in any education or training)
Country 2005 2013
Country 2005 2013
Austria 8 7
Belgium 13 13
France 11 11
Germany 11 6
Ireland 11 16
Luxembourg 6 5
Netherlands 5 5
United Kingdom 8 13
Denmark 4 6
Finland 8 9
Sweden 11 8
Greece 16 20
Cyprus 20 19
Italy 17 22
Malta 12 10
Portugal 11 14
Spain 13 19
Bulgaria 25 22
Croatia 17 20
Czech Republic 13 9
Estonia 11 11
Hungary 13 15
Latvia 10 13
Lithuania 9 11
Poland 14 12
Romania 17 17
Slovak Republic 16 14
Slovenia 9 9

Notes: The diagonal line separates the countries that improved their score (located below the line) from the ones that saw their score deteriorate (located above the line).
Source: Eurostat (Young people not in employment and not in any education and training, 2015)

Figure 4
Long-term unemployment (persons unemployed for at least 12 months as a percentage of the total number of active persons in the labour market)
Country 1995 2013
Country 1995 2013
Austria 1.0 1.2
Belgium 5.8 3.9
France 4.0 4.2
Germany 4.0 2.3
Ireland 7.6 7.9
Luxembourg 0.7 1.8
Netherlands 3.4 2.4
United Kingdom 3.5 1.9
Denmark 2.0 1.8
Sweden 2.3 1.5
Greece 4.6 18.5
Italy 7.1 6.9
Portugal 3.4 9.3
Spain 11.6 13.0
Hungary 5.4 4.9
Slovenia 3.4 5.2

Notes: The diagonal line separates the countries that improved their score (located below the line) from the ones that saw their score deteriorate (located above the line).
Source: Eurostat (Long-term unemployment in active population, 2015)

Read the full chapter on social security here.

References

Individual actors are regarded poor if they consistently lack the means to obtain the minimum necessities of their community. What is considered as minimum necessities varies across countries and over time. A measure of poverty that takes this variation into account is called a measure of contextual poverty.
To mitigate the consequences of loss of income, retired workers receive an old age benefit. The replacement rate captures income from pensions relative to earnings when working.
Young workers are often on short-term contracts, which lead them into precarious situations. Due to their temporary contracts, young people are often the first to be laid off when a company downsizes. In addition, they are often not eligible for redundancy payments due to their limited employment history.
Income data in the EU-SILC surveys from year t are from year t-1 (the income reference period). Two exceptions: Income variables from the United Kingdom refer to the 12-month period centred around the interview date. For Ireland it is the 12-month period prior to the interview date. Thus data from the United Kingdom and Ireland might be more recent than for the other countries.
Individual net pension entitlement, taking into account personal income taxes and social security contributions paid by workers and pensioners. The individual net pension replacement rate captures the level of income from pensions relative to earnings when working.